.jpg)
Below, you can see the North Kona Median Price and Sold Qty changes, month by month from April 2021 ~ April 2023. Prices passed the peak in July 2022; however, prices have not dropped significantly since then.
.jpg)
.jpg)
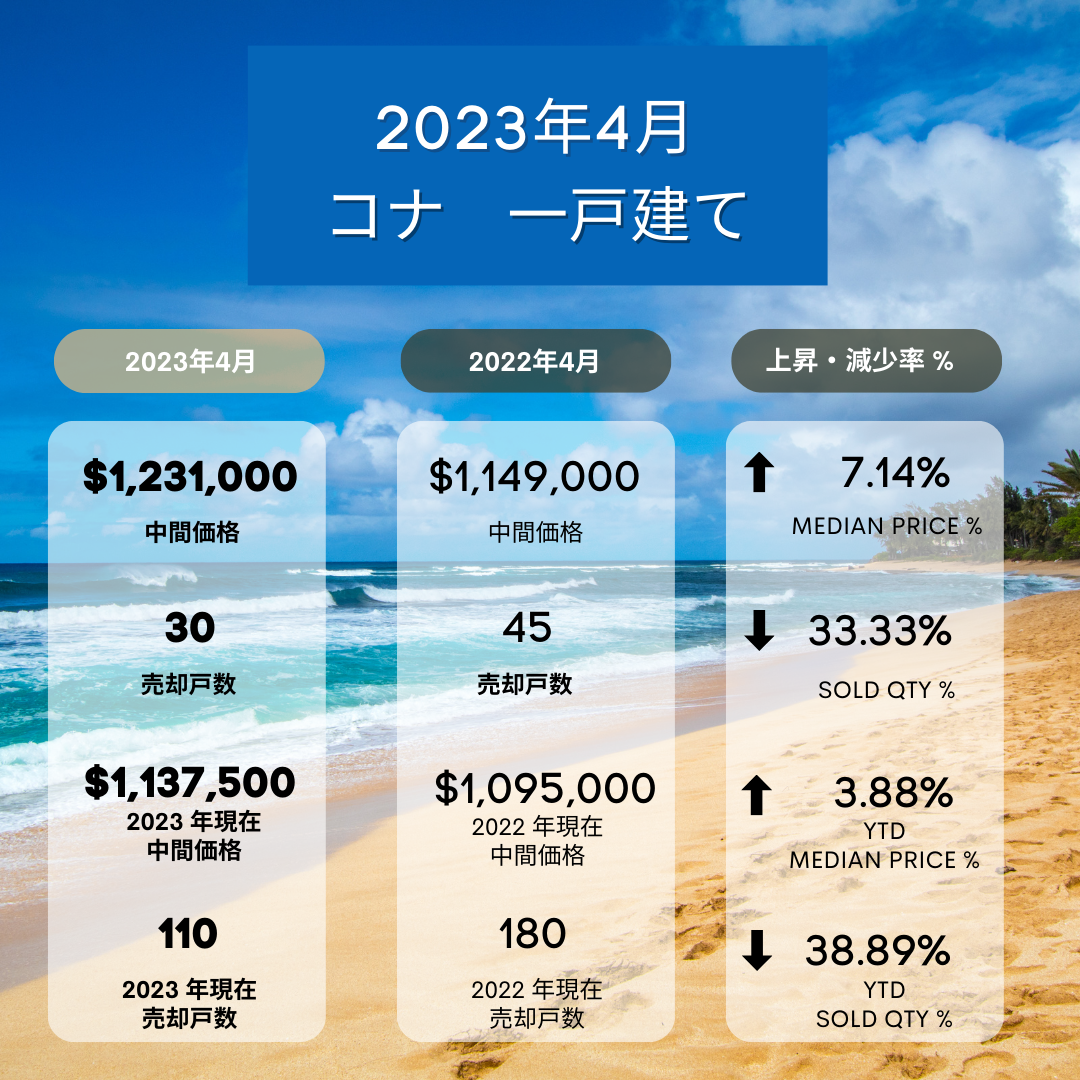
Here’s a look at the April and YTD results for North Kona Residential and South Kohala Residential. Can you see the difference?
.png)
.png)
====================================
コナでは価格が引き続き維持されております
以下は、2021 年 4 月から 2023 年 4 月までの過去2年のコナの中間価格と売却戸数の変化を月ごとに示したものです。価格は 2022 年 7 月にピークを過ぎましたが、それ以来、価格は大幅に下がっておりません。はじめのグラフは、コナの一戸建て。次はコナのコンドです。
以下は、コナの一戸建てとサウス コハラ一戸建ての 4 月と年累計の結果です。 違いがお分かりになりますか?
.png)